

Photography Histogram Explained: How to Read It for Better Exposure

A photography histogram displayed in Adobe Lightroom.
Last Updated: July 2026
- What Is a Photography Histogram?
- Why Histograms Matter for Photographers
- How to Read a Histogram
- Using Histograms to Improve Exposure
- Luminance vs RGB Histograms
- Understanding Histogram Clipping
- Camera Histogram vs Lightroom Histogram
- Using Histograms for Concert Photography
- Using Histograms for Landscape Photography
- Frequently Asked Questions
A histogram is one of the most useful tools available to photographers, yet many photographers ignore it.
You can look at the image preview on your camera and think the exposure looks correct, only to discover later that highlights were blown out, shadows lost detail, or the image needs more editing than expected.
A histogram gives you information that your camera screen cannot always show.
It helps you understand:
brightness distribution
shadow detail
highlight clipping
overall contrast
dynamic range
Whether you photograph concerts, landscapes, portraits, or travel, learning how to read a histogram can help you make better exposure decisions before you even press the shutter.
This guide explains how photography histograms work, how to interpret them, and how to use them in real-world shooting and editing workflows.
What Is a Photography Histogram?
A photography histogram is a visual graph that shows how brightness values are distributed throughout an image.
The histogram displays pixels from:
pure black on the left
pure white on the right
The height of the graph represents how many pixels exist at each brightness level.
Simply put:
left side = shadows
middle = midtones
right side = highlights
A histogram does not tell you whether a photograph is “good” or “bad.”
Instead, it shows you how the tones in your image are distributed so you can decide whether the exposure matches your creative intent.
Example:
A dark concert photograph may naturally have a histogram weighted toward the left because much of the scene is black background and shadow.
A bright beach landscape may naturally have more information toward the right because of:
bright sand
sunlight
reflective water
Neither histogram is automatically wrong.
The important question is whether important details are being preserved.
Why Histograms Matter for Photographers
The biggest advantage of using a histogram is that it gives you objective exposure information.
Your camera's LCD screen can be misleading because brightness changes depending on:
viewing angle
screen brightness
surrounding light conditions
camera display settings
A histogram gives you a more reliable way to evaluate exposure.
Histograms Help Prevent Lost Detail
The two biggest exposure problems are:
Clipped highlights
When pixels reach the far right side of the histogram, important bright areas may lose detail.
Examples:
concert spotlights
clouds at sunrise
reflections on water
white clothing
Once highlights are completely clipped, that information usually cannot be recovered.
Crushed shadows
When pixels are pushed completely to the left, dark areas may lose detail.
Examples:
black clothing
dark stage backgrounds
nighttime landscapes
heavily shadowed areas
Some shadow loss can create mood, but losing important detail can limit editing flexibility.
Histograms Improve Editing Results
A properly exposed RAW file gives you much more flexibility in post-processing.
A histogram helps you capture files with:
better highlight protection
cleaner shadows
more usable dynamic range
easier color adjustments
This is especially important for:
concert photography
landscape photography
commercial photography
images intended for prints
How to Read a Photography Histogram
Reading a histogram becomes much easier once you understand what the graph represents.
Think of it as a map of brightness.
The Left Side: Shadows
The left side represents the darkest parts of the image.
A large amount of information on the left usually means the image contains:
dark areas
shadows
black tones
This is common in:
night photography
concerts
dramatic portraits
A histogram leaning left does not automatically mean the image is underexposed.
The Middle: Midtones
The center represents middle brightness values.
This includes:
skin tones
normal textures
many landscape details
Many traditionally exposed images have a large amount of information in the middle.
The Right Side: Highlights
The right side represents the brightest areas.
This includes:
skies
bright lights
reflections
white objects
Watch the far-right edge carefully.
If the graph is pressed against the edge, highlights may be clipped.
Understanding Shadows, Midtones, and Highlights
A histogram is divided into three general tonal areas:
Shadows
Dark portions of the image.
Examples:
stage backgrounds
forest areas
night scenes
Goal:
Maintain enough detail unless the darkness is intentional.
Midtones
The most visually important area in many photographs.
Examples:
faces
landscapes
clothing
textures
Midtones often determine whether an image feels natural.
Highlights
The brightest areas.
Examples:
sunlight
stage lighting
reflections
bright skies
Highlights require careful attention because clipped areas cannot usually be recovered.
Using Histograms to Improve Exposure
The histogram is most valuable when used as a decision-making tool while shooting.
Instead of asking:
"Is the histogram centered?"
Ask:
"Am I protecting the important information in this image?"
The Goal Is Not Always a Perfectly Balanced Histogram
A common beginner mistake is thinking every histogram should look like a smooth mountain centered in the middle.
That is not true.
Different subjects naturally create different histogram shapes.
Examples:
Night concert photo
May have:
heavy shadows
bright stage lights
uneven distribution
Snow landscape
May have:
mostly highlights
little shadow information
Silhouette photo
May have:
large dark areas
small highlight areas
The correct histogram depends on the scene.
The Better Approach: Expose for Important Details
Instead of chasing a perfect graph:
Protect what matters.
Examples:
Concert photography:
protect performer faces
avoid destroying stage lights
Landscape photography:
protect sky detail
preserve shadow texture
Portrait photography:
protect skin tones
The histogram is a guide, not a rule.
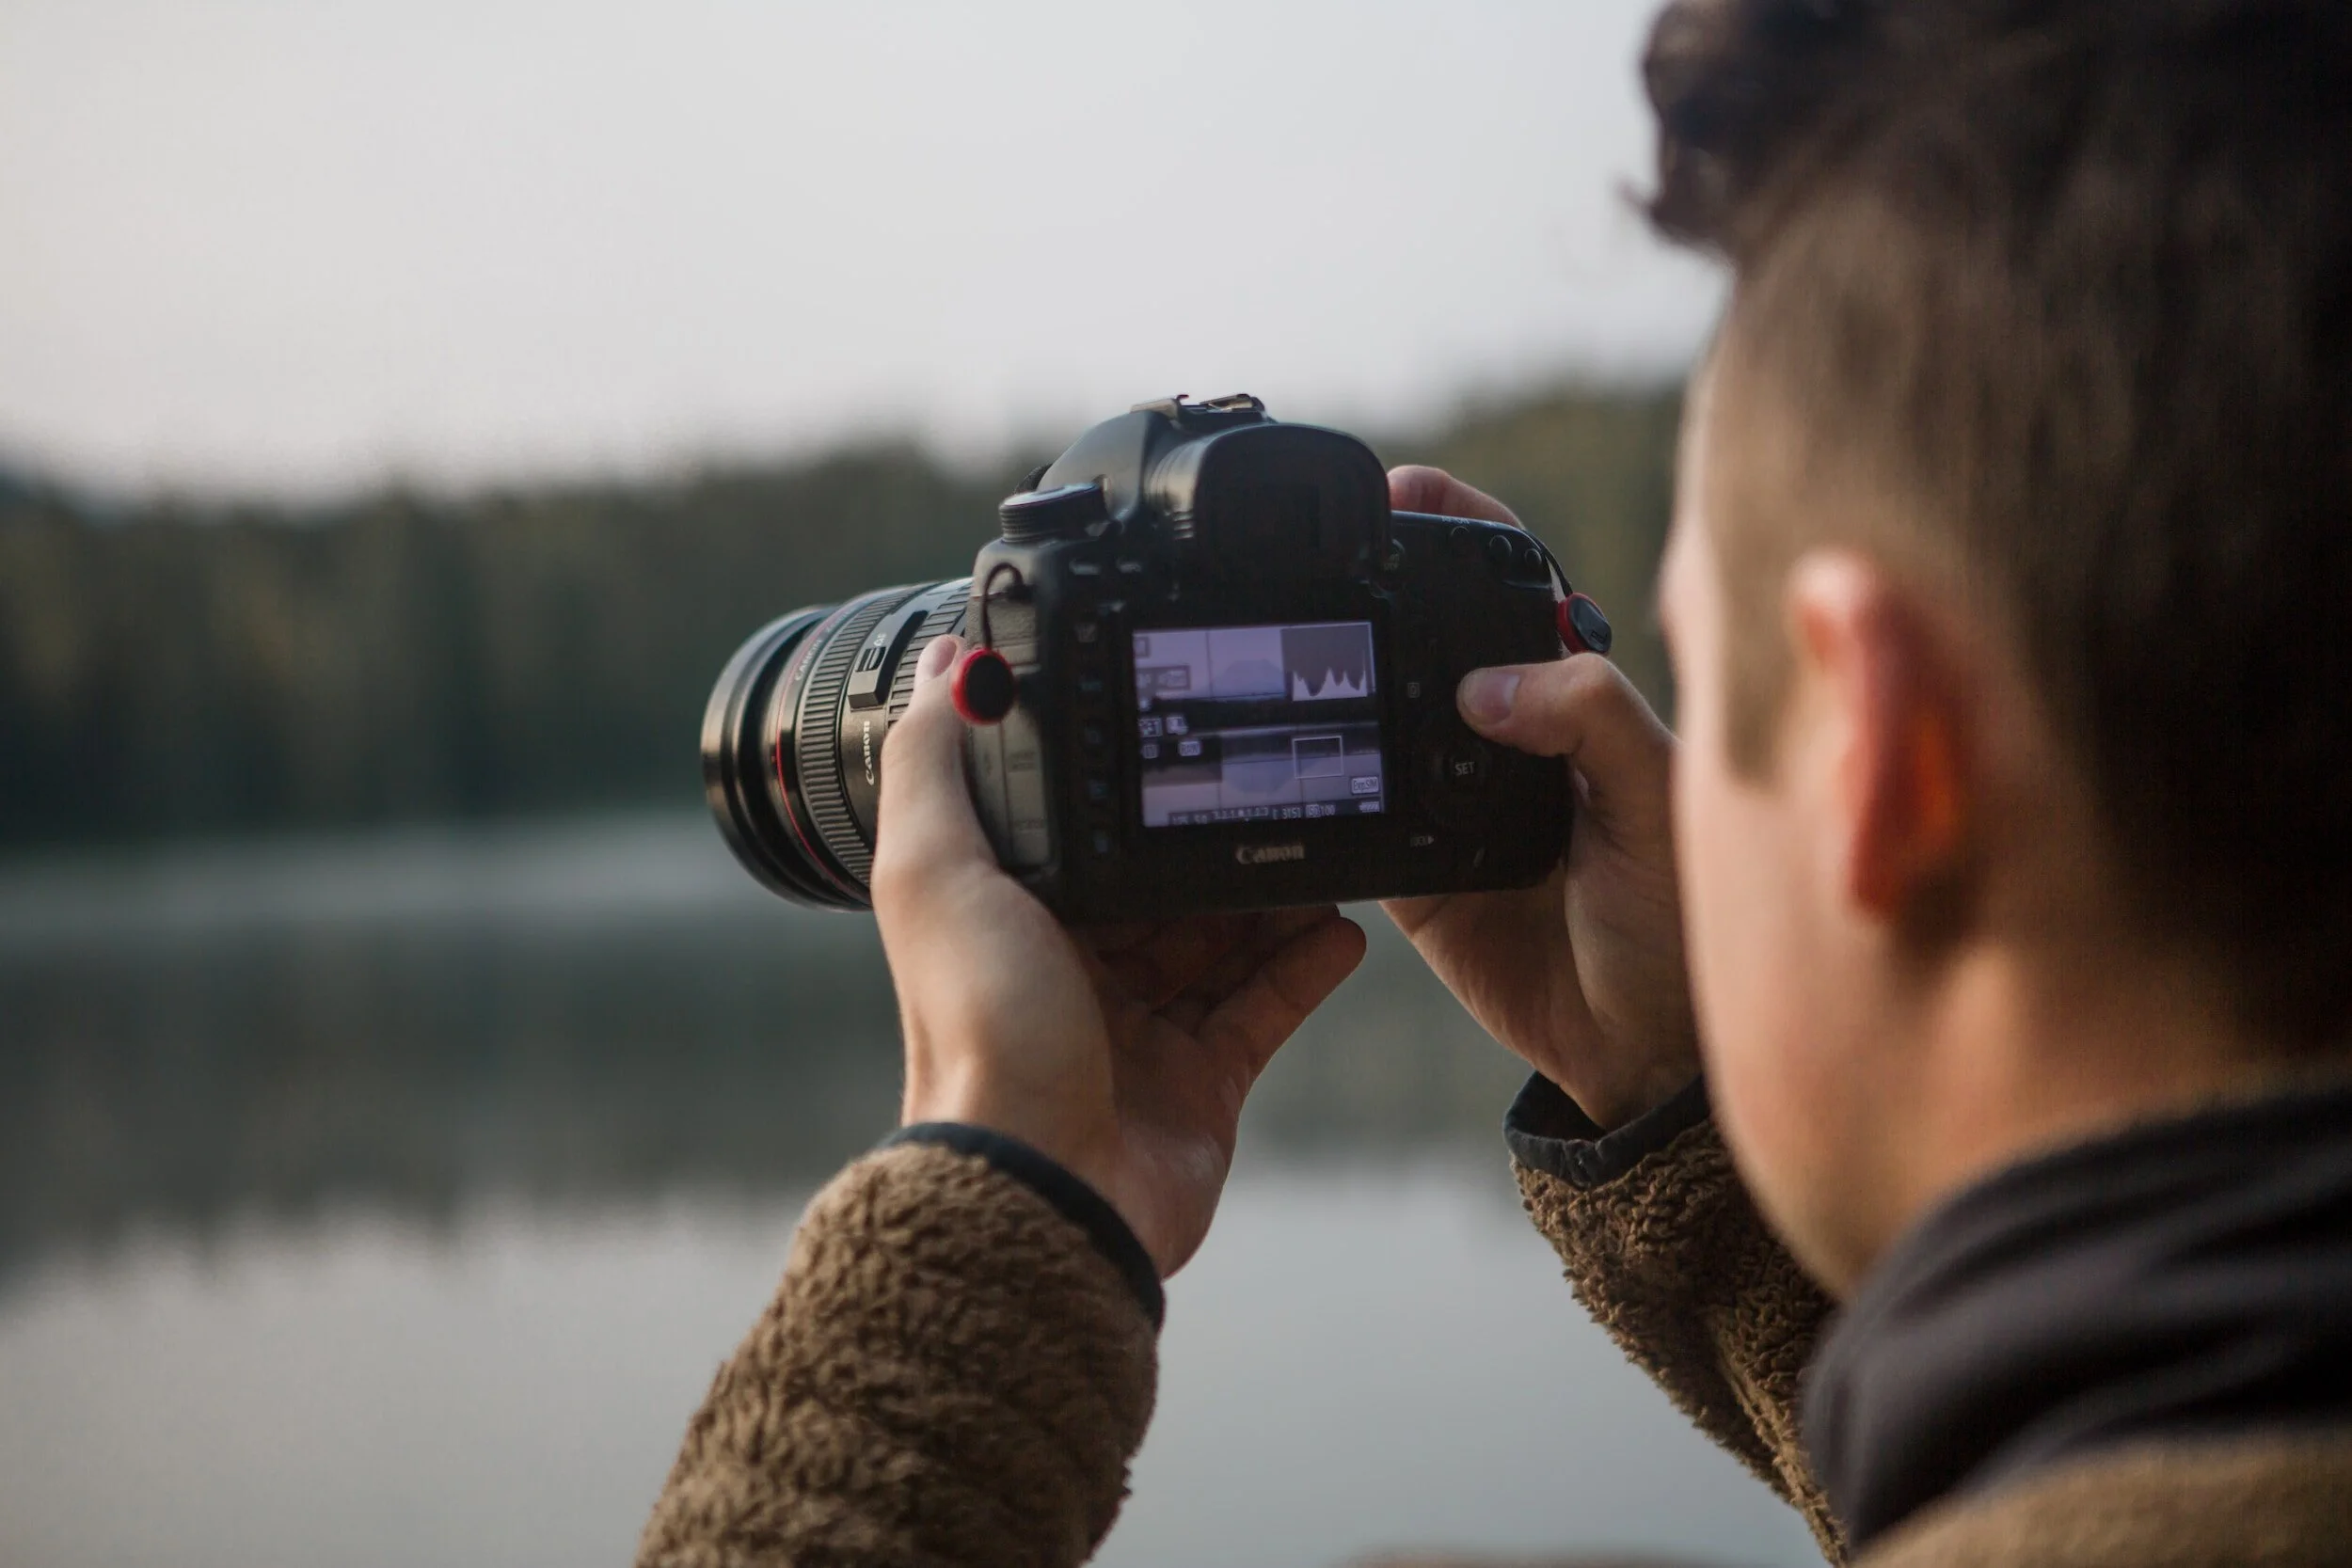
A DSLR camera with the histogram display.
Luminance vs RGB Histograms
Most cameras and editing programs offer more than one type of histogram.
The two most common are:
luminance histogram
RGB histogram
Understanding the difference can help you make better exposure decisions, especially when color accuracy matters.
Luminance Histogram
A luminance histogram shows the overall brightness values of an image.
It combines the brightness information from all colors into one graph.
A luminance histogram is useful for:
evaluating exposure
checking shadow detail
preventing highlight clipping
making quick exposure decisions
For many photographers, this is the most practical histogram to monitor while shooting.
RGB Histogram
An RGB histogram separates brightness information into individual color channels:
red
green
blue
This provides more detailed information about color exposure.
An image can appear properly exposed on the luminance histogram but still have a clipped color channel.
Example: Bright Red Stage Lighting
Concert photographers often encounter intense colored lighting.
A performer may be illuminated by:
red spotlights
blue LEDs
purple stage effects
The overall brightness may look acceptable, but the red channel may be pushed too far.
An RGB histogram can reveal:
clipped reds
color imbalance
potential loss of detail
Which Histogram Should You Use?
For most situations:
Luminance histogram
→ Best for general exposure decisions
RGB histogram
→ Best when color accuracy matters
For your style of photography:
Concert photography:
RGB histogram can be helpful because of extreme colored lighting
Landscape photography:
RGB histogram helps when dealing with sunsets, skies, and saturated colors
Understanding Histogram Clipping
Histogram clipping happens when pixels exceed the camera sensor's ability to record detail.
There are two types:
highlight clipping
shadow clipping
Highlight Clipping
Highlight clipping occurs when pixels reach the far right edge of the histogram.
Those areas become pure white with no recoverable detail.
Common examples:
bright sunlight
stage spotlights
reflections on water
clouds during sunrise
How to Avoid Highlight Clipping
You can protect highlights by:
lowering exposure
reducing ISO
using exposure compensation
shooting RAW
using the highlight warning ("blinkies") feature
Shadow Clipping
Shadow clipping happens when pixels are pushed completely to the left.
This creates areas with no recoverable information.
Common examples:
dark concert backgrounds
nighttime scenes
deep forest shadows
Should You Always Avoid Clipping?
No.
Photography is creative.
A silhouette, for example, intentionally uses crushed shadows.
A concert photograph may intentionally allow stage lights to clip because they represent the energy of the performance.
The goal is not eliminating clipping.
The goal is controlling it.
Exposing to the Right (ETTR)
Exposing to the Right (ETTR) is a technique where photographers intentionally expose an image slightly brighter while keeping highlights from clipping.
The idea is to move the histogram toward the right side.
Why?
Because digital camera sensors capture more tonal information in brighter areas.
A brighter RAW file can often contain:
cleaner shadows
less noise
more editing flexibility
ETTR Example
Imagine photographing a landscape at sunrise.
A darker exposure may create:
noisy shadows
less editing flexibility
A slightly brighter exposure may preserve:
more shadow detail
cleaner color
smoother gradients
When ETTR Works Well
ETTR can be useful for:
landscapes
architecture
studio photography
controlled lighting situations
When ETTR Is Difficult
It is less practical for:
concerts
wildlife
fast-moving subjects
unpredictable lighting
In these situations, getting the moment matters more than optimizing the histogram.
ETTR and RAW Photography
ETTR works best with RAW files because RAW captures much more information than JPEG.
You can often recover a slightly bright RAW file more easily than an underexposed one.
Camera Histogram vs Lightroom Histogram
The histogram you see on your camera is useful, but it is not identical to the histogram you see during editing.
This difference is important.
Camera Histogram
The in-camera histogram is generated from the camera's JPEG preview.
Even if you shoot RAW, your camera creates a processed preview to display.
This means the histogram may reflect:
picture style settings
contrast adjustments
saturation settings
It is a helpful guide, but it is not the complete RAW data.
Lightroom Histogram
The Lightroom histogram shows information from the actual imported file.
This gives you a more accurate view of:
RAW exposure
tonal adjustments
editing changes
Why This Matters
A camera histogram may show a highlight warning, but your RAW file may still contain recoverable detail.
Conversely, an image that looks fine on the camera screen may reveal problems when opened on a calibrated monitor.
Best Practice
Use the camera histogram to:
avoid obvious exposure mistakes
protect important highlights
make quick adjustments
Use Lightroom's histogram to:
refine exposure
edit accurately
prepare final images
RAW vs JPEG Histogram Differences
The histogram behaves differently depending on whether you shoot RAW or JPEG.
JPEG Histogram
A JPEG histogram represents a processed image.
The camera has already applied:
contrast
sharpening
color processing
noise reduction
The histogram is closer to the final appearance.
RAW Histogram
A RAW file contains much more information.
The histogram may not fully represent the sensor data because the camera is displaying a processed preview.
RAW provides more flexibility for recovering:
shadows
highlights
color adjustments
Why Photographers Prefer RAW
For demanding situations like:
concerts
sunsets
dramatic landscapes
RAW gives you more room to adjust exposure later.
Using Histograms for Concert Photography
Concert photography is one of the most challenging situations for using a histogram.
Lighting changes constantly.
You may go from:
a dark stage
a bright spotlight
red lighting
complete darkness
within seconds.
What to Watch For
Prioritize:
Protecting faces
The performer is usually the most important part of the image.
Avoid losing detail in:
skin tones
facial expressions
clothing texture
Watching Stage Lights
Bright LEDs and spotlights will often clip.
That is normal.
Do not underexpose the entire image just to save every light source.
Maintaining Shutter Speed
A histogram can tell you about exposure, but it cannot tell you if the performer is blurry.
Always prioritize:
sharp focus
motion control
timing
Concert Photography Histogram Strategy
A practical approach:
Check your histogram before the show.
Adjust ISO and aperture for the venue.
Watch highlight warnings during bright lighting.
Keep important subjects properly exposed.
Adjust in RAW processing later.
Using Histograms for Landscape Photography
Landscape photography often benefits greatly from histogram awareness.
Unlike concerts, landscapes usually allow more time to evaluate exposure.
Common Landscape Histogram Challenges
Bright skies
Sunrise and sunset scenes often create:
bright highlights
darker foregrounds
The histogram helps identify whether the sky is losing detail.
Deep shadows
Mountain scenes, forests, and coastal landscapes can contain large tonal differences.
A histogram helps determine whether:
shadows need protection
exposure blending may help
bracketing is useful
Landscape Histogram Tips
For landscapes:
shoot RAW
protect highlights
use your lowest practical ISO
consider exposure bracketing
review the histogram after important shots
Histograms in Lightroom and Photoshop Editing
Histograms are not just useful while shooting.
They are also valuable during editing because they show how adjustments affect the tonal range of your image.
Programs like Adobe Lightroom and Photoshop provide histograms that update as you edit.
This allows you to see how changes affect:
shadows
midtones
highlights
contrast
color channels
Using the Histogram in Lightroom
In Lightroom, the histogram appears in the Develop module and changes as you adjust:
Exposure
Contrast
Highlights
Shadows
Whites
Blacks
For example:
Increasing exposure moves the histogram toward the right.
Lowering highlights pulls the brighter tones back.
Increasing shadows shifts dark areas toward the middle.
Using Histogram Warnings in Lightroom
Lightroom also provides clipping warnings.
These show areas where detail may be lost.
Highlight clipping
Shows areas becoming pure white.
Useful for checking:
bright skies
reflections
stage lighting
Shadow clipping
Shows areas becoming pure black.
Useful for checking:
dark backgrounds
nighttime scenes
deep shadows
Using Histograms in Photoshop
Photoshop provides histogram information through the Histogram panel.
This is especially useful when using:
Curves adjustments
Levels adjustments
masking
color grading
The histogram helps you make controlled adjustments instead of guessing.
Histograms and RAW Editing
For RAW photographers, the histogram becomes especially powerful because you have more flexibility.
You can often recover:
slightly overexposed highlights
dark shadows
color shifts
without significantly damaging image quality.
Advanced Histogram Techniques
Once you understand basic histogram reading, you can use more advanced techniques to improve your workflow.
Using RGB Channels Separately
The RGB histogram can reveal problems that a standard brightness histogram misses.
A single color channel may be clipping even if the overall exposure looks acceptable.
This commonly happens with:
sunsets
concert lighting
colorful subjects
neon environments
Monitoring Contrast
The width of the histogram gives you a general idea of contrast.
A wide histogram usually indicates:
strong contrast
deep shadows
bright highlights
A narrow histogram usually indicates:
softer lighting
lower contrast
flatter tones
Neither is automatically better.
The correct contrast depends on the image you are creating.
Using Histograms for HDR and Exposure Blending
Landscape photographers often use histograms when creating HDR images or exposure blends.
The goal is to capture:
highlight detail
shadow detail
full dynamic range
Examples:
sunrise landscapes
mountain scenes
interior/exterior architecture
A histogram helps determine whether one exposure is enough or whether multiple exposures are needed.
Using Histograms With Bracketing
Exposure bracketing captures multiple versions of the same scene at different exposures.
Histograms help confirm:
darkest exposure protects highlights
brightest exposure captures shadows
This is especially useful when photographing scenes with extreme contrast.
Common Histogram Mistakes
Histograms are powerful, but they are easy to misunderstand.
Here are the most common mistakes photographers make.
Mistake 1: Thinking Every Histogram Should Be Centered
A histogram does not need to look perfectly balanced.
A nighttime photo may naturally lean left.
A snowy landscape may naturally lean right.
The histogram should match the scene.
Mistake 2: Ignoring the Actual Image
A histogram is only one piece of information.
Do not rely on it without considering:
subject
lighting
mood
creative intent
A technically perfect histogram can still produce a boring photograph.
Mistake 3: Underexposing Everything to Protect Highlights
Some photographers become afraid of clipping and make their entire image too dark.
This creates:
noisy shadows
less editing flexibility
weaker image quality
Protect important highlights, but do not sacrifice the entire exposure.
Mistake 4: Ignoring RGB Channels
A luminance histogram may look fine while a color channel is clipping.
This is common with:
red concert lights
colorful sunsets
saturated landscapes
Mistake 5: Forgetting RAW Gives More Flexibility
A histogram is only part of the exposure decision.
RAW files give photographers more room to adjust afterward.
Best Histogram Settings by Photography Style
Different types of photography require different histogram priorities.
There is no single “perfect” histogram.
Concert Photography
Recommended priorities:
protect performer faces
maintain fast shutter speeds
avoid extreme underexposure
watch colored light clipping
Typical histogram:
often weighted left
bright peaks from stage lighting
uneven distribution
Landscape Photography
Recommended priorities:
protect sky detail
preserve shadow information
maximize dynamic range
Typical histogram:
wider tonal range
possible highlights from sky
detailed shadows
Helpful techniques:
RAW shooting
exposure bracketing
tripod use
Portrait Photography
Recommended priorities:
protect skin tones
maintain natural contrast
avoid highlight clipping
Watch:
forehead highlights
bright clothing
reflections
Wildlife Photography
Recommended priorities:
maintain shutter speed
preserve animal detail
avoid losing shadow texture
Histogram considerations:
expose for the subject
adjust quickly
avoid missing the moment
Street and Travel Photography
Recommended priorities:
react quickly
preserve important details
avoid overthinking
Useful approach:
use histogram checks between scenes
trust experience in fast situations
Practical Workflow Recommendations
A good histogram workflow does not need to slow down your photography.
The goal is to use it as a quick confirmation tool.
Before Shooting
Check:
camera histogram settings
highlight warnings
RGB histogram availability
Make sure you understand what your camera is showing.
During Shooting
Use the histogram to answer:
Are important highlights clipping?
Are shadows completely lost?
Is exposure close to where it needs to be?
Do not spend so much time analyzing that you miss the moment.
After Shooting
During editing:
Review the histogram in Lightroom.
Adjust exposure carefully.
Check highlights and shadows.
Review color channels.
Export and verify final images.
Recommended Histogram Workflow for Chris Sidoruk Media Style
For concert photography:
shoot RAW
expose for performers
accept some stage light clipping
prioritize sharpness and emotion
For landscape photography:
shoot RAW
protect highlights
use histogram after composition
bracket when needed
Final Recommendations
A photography histogram is one of the simplest tools that can dramatically improve your exposure decisions.
The biggest takeaway:
Do not chase a perfect histogram. Learn what the histogram is telling you.
Use it to:
protect important highlights
preserve shadow detail
understand dynamic range
make better exposure choices
For most photographers:
shoot RAW
enable histogram display
learn to read clipping warnings
review important images in the field
The histogram will not replace your creative judgment, but it will help you capture files with more information and flexibility.
For concert photographers, it helps manage difficult stage lighting.
For landscape photographers, it helps maximize dynamic range.
For every photographer, it creates a better understanding of exposure.
Frequently Asked Questions
What is a histogram in photography?
A histogram is a graph that shows how brightness values are distributed in an image, from shadows on the left to highlights on the right.
Should a photography histogram always be centered?
No. A centered histogram is not always correct. The ideal histogram depends on the subject and lighting conditions.
What does the left side of a histogram represent?
The left side represents darker tones and shadows.
What does the right side of a histogram represent?
The right side represents brighter tones and highlights.
Should I use the RGB histogram or luminance histogram?
Both are useful. Luminance is better for general exposure, while RGB helps identify color channel clipping.
Is the histogram different for RAW and JPEG files?
Yes. JPEG histograms represent processed images, while RAW files contain more editing flexibility and sensor information.
Can histograms help with landscape photography?
Yes. Histograms are especially useful for protecting highlights in sunrise, sunset, and high dynamic range landscape scenes.
Can histograms help with concert photography?
Yes. They help photographers balance dark environments, bright stage lighting, and changing exposure conditions.
Why does my photo look fine but the histogram looks wrong?
Because a histogram does not understand the subject. A dark image or bright image can be correct if it matches the intended result.
==========
